Research Article | | Peer-Reviewed

How Much Physical Activity Is Needed for 75 Year and Older Adults: Using NHANES Datasets

Received: 24 February 2024    Accepted: 11 June 2024    Published: 26 June 2024
Views:       Downloads:
Abstract

Targets: To examine the amount/level of Physical Activity (PA) needed to generate the most health benefits in noninstitutionalized 75 year and older U.S. resident adults. Intervention description: A total of 598 sample participants aged 75 year and above from National Health And Nutrition Examination Survey (NHANES) 2005-2006 datasets were included. Actigraph-monitored daily step counts, self-reported PA duration (time spent in weekly PA) and weekly energy expenditure were used to describe PA level/amount. Functional ability was expressed using the total levels of difficulties in doing twenty-one types of daily activities. PRISM Dose-response Curves Stimulation Variable slope model was applied to examine the needed PA level/amount in the population. Mechanisms of action: PA benefits functional health in 75 year and older adults. Older females aged 75- 84 year need at least 150 mins/ 800 kcal energy expenditure per week or 5,800 daily steps to reach the most functional benefits. Older men aged 75-84 year need walk about 5,800 steps/day to achieve higher level of functionality. Older adults aged 85 years and above need to spend about 240 minutes/week on PA to gain health benefits. Outcomes: Older males generally need/engage in more amount of PA compared to their female counterparts. Between 75-84 year old male and female adults, PA intensity is more important/reflective in male for expressing PA amount, while time spent in PA is more meaningful to older females. There is no difference in needed PA amount between different genders in 85 year and older adults.

Published in Science Journal of Public Health (Volume 12, Issue 3)
DOI 10.11648/j.sjph.20241203.15
Page(s) 92-102
Creative Commons

This is an Open Access article, distributed under the terms of the Creative Commons Attribution 4.0 International License (http://creativecommons.org/licenses/by/4.0/), which permits unrestricted use, distribution and reproduction in any medium or format, provided the original work is properly cited.

Copyright

Copyright © The Author(s), 2024. Published by Science Publishing Group

Keywords

Physical Activity, Older Adults, Functional Ability, Walking Steps, Energy Expenditure, Dose-Response

1. Introduction
Both the number and age of older population continue to grow unprecedently. Older adults are defined as aged 65 years and older. The total older adult population can be divided into three age groups: the young-old (aged 65–74), the middle-old (ages 75–84), and the old-old (over age 85) . Among the three age groups, the number of middle-old and old-old adults are increasing much faster than the young-old. The 2020 profile of older Americans reported that the total number of middle-old and old-old adults has reached 22.6 million, which occupied 42% of the total older population . More researches are called specifically on 75 years and older adults group, describing sub age groups in the general 65+ population enables a more accurate portrayal of life activities and significant changes regarding the very different conditions that older adults experience as they grow older .
The benefits of regular PA occur throughout life. With the development of science and technology, older adults are living longer with improving quality of lives. Many 75 year and older adults are actively engaging in daily PA . PA public health guidelines suggested at least 150 to 300 minutes of moderate-intensity PA per week, or an amount of 75 to 150 minutes of vigorous-intensity activity, or an equivalent combination of both moderate and vigorous activities are needed for general adult population including 65 year and older adults . However, majority of older adults didn’t meet the guidelines suggested PA amount . Older adults aged 65 year and older engage in less amount of PA as their age increases, especially in 75 year and older elders due to functional decline, chronic diseases/conditions, disability, and/or frailty, etc. There is also increased risk of injury and physical harm with extra amount of PA in older elders, considering many of them have activity-tolerant health conditions.
The amount of PA needed to generate the most health benefits has been studied for decades by scientists in the field Three patterns of dose-response relationships (curve A, B, C) were proposed in the evidence- based symposium held by the experts in the field in 2000. Guidelines proposed PA dosage were studied as based upon the dose-response curve A pattern (Figure 1) A positive dose-response relationship between PA and an improvement in activity of daily living in the elderly was found based on uncontrolled/ nonrandomized trials or observation studies However, the relationship is not clear in the 75 years and older population. Evidence also showed that being more stable/having less change, or small increases in PA time and energy expenditure was beneficial in maintaining the functional ability for community-dwelling older adults A higher level of PA energy expenditure (>4000 kcal/week) was considered related to functional ability improvement However, these findings were all based on small sample size studies. There was also a discrepancy in older age groups categorization among study samples.
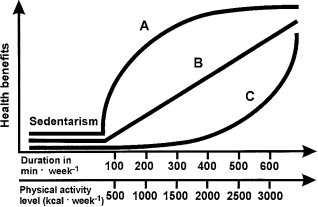
Figure 1. Schematic illustration depicting the relationships between PA level defined in minutes of participation per week or energy expended.
Step counts has become a common method of assessing daily PA for older individuals. The PA Guidelines Advisory Committee (PAGAC) stated that it is important to better understand how the measurement of steps per day might fit into the assessment of daily or weekly PA exposures and their relationship to important health Older adults approximately engaged one-third of their daily time in PA. Walking is the major contributor to moderate-to-vigorous PA, as well as light PA in functioning community-dwelling 65+ older adults A number of 7,000-10,000 steps/day for 65+ healthy older adults were suggested which was approximately equivalent to guidelines recommendations . However, preliminary evidence suggests that a goal of 10,000 steps/day may not be sustainable for older adults and those living with chronic diseases . A possible progression of osteoarthritis may occur at step count per day greater than 10,000 Some study findings indicated the number of daily steps needed was between 6500 and 8000 or more for community-dwelling 65 and older adults A number of 5000 steps per day for those 75- to 79-year-old for achieving most of the benefit from PA Overall, there is not enough evidence or consensus on the relationships between daily step counts and independent living/functional ability in older adults, especially in 75 year and older adults. It is not clear on the recommended amount of step counts for older adults to achieve health benefits.
In a summary, regular PA is a beneficial and feasible approach to improve functional ability and health outcome in older adult population. There is generally a positive relationship between PA level and functional ability in 65 years and older adults. However, how much PA is enough/needed, or whether there is a least amount of PA to maintain functional ability or generate the most health benefits in the 75 years and older adults remains unknown.
2. Theoretical Framework
The activity theory (of aging) proposes that successful aging occurs when older adults stay active The activity theory pointed to the importance of engaging in PA in aging, which provided a fundamental basis for this study.
The relationships between regular PA levels and health benefits provided an operational framework for this study (Figure 1) The dose-response model shows that generally a larger amount of PA contributes to a higher level of functional ability. Curve B is a linear relationship. Curve A specifies that the health benefits are attained at low to moderate levels of PA, and there seems to have a ceiling PA value by where health benefits reach their highest limits. In contrast, curve C specifies that the greatest benefits are obtained only when the level of PA is rather high. Bouchard stated that current guidelines recommendations are based upon the curve A pattern. This dose-response model, specifically curve A pattern was used as an operational foundation for our study to examine the relationships between the amount of PA and functional ability in middle-old and old-old adults.
3. Methods
This study used a secondary data analysis design. NHANES 2005-2006 datasets were used. NHANES sample represents the total noninstitutionalized civilian population residing in the 50 states and District of Columbia in the United States. Persons 60+ years of age were oversampled in NHANES 2005-2006 due to the dramatic growth in the number of older people. The inclusion criteria of this study were: aged 75 years and above participants in the datasets. The exclusion criteria were: 1) questionable data according to the reliability status; 2) step records >200 steps per minute; 3) zero total step records. A total of 598 middle-old and old-old participants were included in the analysis. All NHANES survey protocols were reviewed and approved by the National Center for Health Statistics (NCHS) Research Ethics Review Board (ERB) before implementation. Informed consent was obtained from every participant of NHANES. A further IRB review for this secondary research was exempted according to the Code of Federal Regulation Basic HHS (U.S. Department of Health & Human Services) Policy for Protection of Human Research Subjects §46.104 Exempt research no.4 regulation (Exemptions (2018 Requirements), 2021). All needed datasets and variables were publicly available and directly downloaded from NHANES website. No limited access data was used in this analysis.
3.1. Health Benefits
NHANES Physical Functioning Questionnaire(PFQ) question PFQ.061 was used to describe health outcomes in 75 years and older adults. Participants were asked about difficulty levels in doing twenty-one types of daily activities, with four option answers of “no difficulty, some difficulty, much difficulty and unable to do”. Responses were coded as 1 for no difficulty, 2 for some difficulty, 3 for much difficulty, and 4 for unable to do. The final functional benefits scores were achieved by subtracting total difficulty scores from 0, so that bigger scores represent higher/better functional abilities for older adults.
3.2. Steps Per Day
Daily step counts were recorded by PA monitors (PAM) (ActiGraph AM-7164 (formerly the CSA/MTI AM-7164), manufactured by ActiGraph of Ft. Walton Beach, FL.). The PAM was placed on an elasticized fabric belt, custom-fitted for each participant, and worn on the right hip. Participants were asked to wear the monitor for consecutive 7 days and remove it before water-related activities such as swimming or bathing, and to remove the device at bedtime. The activity monitors were returned by mail in postage-paid padded envelopes that were provided. Subjects received $40 remuneration after their monitors were returned. Participants who used wheelchairs and or had other impairments that prevented them from walking or wearing the PAM device were excluded.
3.3. Weekly Energy Expenditure and PA Duration
Subjective PA amount was measured using NHANES PA questionnaires (PAQ). The total amount of PA was summed from transportation-related activity, daily activities in or around home or yard, and leisure time activities. Transportation-related activity was measured by PAQ.020, PAQ.050, PAQ.080. Daily activity in or around home or yard that required moderate or greater physical effort was assessed using PAQ.100, PAQ.120, PAQ.160. Leisure time vigorous PA types, frequency, and duration were measured by PAQ.206, PAQ.221, PAQ.281, PAQ.300. PAQ. Leisure time moderate PA types, frequency, and duration were measured by 326, PAQ.341, PAQ.401, PAQ.420. PA duration were calculated based on reported frequency and duration in each type of PA. Weekly energy expenditure (kcal) was calculated from Metabolic equivalent task (MET) minutes and using 3.5 as the standard resting metabolic rate (RMR) (Hall et al., 2014).
3.4. Statistical Analysis Model
The PRISM Dose-response Curves Stimulation Variable slope model was used to explore the relationships between the amount of PA and functional ability in 75-84 year old and 85 year and older adult groups. Dose-response pattern, possible threshold/cutting values were examined. Gender differences within each age group were analyzed . Factors that could affect PA and functional ability in older adults were collected and analyzed in the demographics.
4. Results
4.1. Demographics
Among the total 598 older participants, the number of the middle-old (aged 75-84) was 36% and the old-old adults was 14.3% of the total sample. Either male or female gender was collected in NHANES datasets. Male older adults were a little outnumbered than females in the middle-old group. However, female took up to 62% in the old-old group. More than half of middle-old adults in the sample were married. In the old-old group, almost 70% adults were widowed. Majority of this sample was non-Hispanic white. Older adults tended to have more numbers of medical conditions as their age increases. The majority (around 70%) of the older participants had zero or 1-2 medical conditions. More older adults had 3+ medical conditions as they age (Table 1).
Table 1. Demographics.

Percent/Mean SD (Middle-old)

Percent/Mean SD (Old-old)

Sample Size

N=428

N=170

Age

79.52.80

85

Gender

Male

236 (55.1%)

65 (38.2%)

Female

192 (44.9%)

105 (61.8%)

Marital Status

Married

230 (53.7%)

43 (25%)

Widowed

144 (33.6%)

117 (68.8%)

Divorced

37 (8.6%)

1 (0.6%)

Separated

7 (1.6%)

2 (1.2%)

Never married

7 (1.6%)

3 (1.8%)

Race/Ethnicity

Non-Hispanic White

324 (75.7%)

137 (80.6%)

Non-Hispanic Black

60 (14%)

17 (10%)

Mexican American

31 (7.2%)

11 (6.5%)

Other Race -including multi-racial

8 (1.9%)

5 (2.9%)

Other Hispanic

5 (1.2%)

0 (0%)

Education Level

Less Than 9th Grade

94 (22%)

45 (26.5%)

9-11th Grade(Includes 12th grade with no diploma)

70 (16.4%)

26 (15.3%)

High School Grad/GED or Equivalent

118 (27.6%)

41 (24.1%)

Some College or AA degree

92 (21.5%)

39 (22.9%)

College Graduate or above

52 (12.1%)

16 (9.4%)

Total Numbers of Medical Conditions

Zero medical condition

91 (21.3%)

21 (12.4%)

1-2 medical conditions

206 (48.1%)

101 (59.4%)

3-5 medical conditions

111 (26%)

43 (25.2%)

>5 medical conditions

19 (4.4%)

5 (3%)

Body Mass Index (BMI)

27.35.17

25.64.47

4.2. Functional Ability in Middle-Old and Old-Old Adults
The old-old adults has significantly higher level of difficulties (N=55, MSD=26.58.28) in doing daily activities than the middle-old (N=248, MSD=23.35.29) (F(2)=16.269, p <.001). Female elders have a significantly higher level of difficulty in doing daily activities than males in middle-old adults (t (730) = -3.747, p<.001). there is no difference in functional ability between male and female in the old-old group (Table 2).
Table 2. Functional ability and physical activity in older adults.

n

Difficulty level in doing 20 types of daily activities (Mean SD)

n

Steps per day (Mean SD)

n

Weekly energy expenditure (kcal) (Mean SD)

n

Weekly PA duration (min) (Mean SD)

Middle-old

Male

142

22.64.12

202

53823009

169

29293705<sup></sup>

178

479616<sup></sup>

Female

106

24.36.44<sup></sup>

157

48102691

104

17072519

115

342445

Total

248

23.3 5.29

359

51322884

273

24643352

293

425558

Old-old

Male

30

25.56.73

46

42033750

34

18292158<sup></sup>

40

332381

Female

25

27.89.82

69

28062354

37

9571205

37

227275

Total

55

26.5 8.28<sup></sup>

115

33653054

71

13751771

77

282336

(P<0.05, =.05)
4.3. PA Level in Middle-Old and Old-Old Adults
Ambulatory community-dwelling middle-old adults walk around 5100 steps per day. the old-old adults takes about 3300 steps per day. Older adults aged 75-84 years take more daily steps than those 85 years old and above (F(2) =56.003, p<.001). There is no difference in daily walking steps between 75-84 years old men and women. Older men aged 85 years and above walk more daily steps than older women aged 85 years and above (t(113)= 2.455, p=.016). (Table 2).
Older adults’ average weekly energy expenditure (kcal) (N=785, MSD =2911 4210) varies between individuals (Table 2). There is no significant difference in weekly energy expenditure on PA between middle-old and old-old adults. Male older adults aged 75 years and older spent significantly more energy in PA than the same age females (F(783)=5.089, p<.001).
U.S. community dwelling older adults spend different length of time in PA weekly (minute) (N=830, MSD=470 604). there is no significant difference in weekly PA duration between middle-old and old-old adults. Male older adults spent significantly more time in PA than females in the middle-old adults (t(287)=2.215, p=.028). However, there is no difference in PA duration between male and female in the old-old group (Table 2).
Mild correlation was found between objectively measured step counts and self-reported PA duration (Pearson’ r(724) =.228, p <.001). Energy expenditure and PA duration were highly correlated (Pearson’ r(785) =.948, p <.001). Energy expenditure was calculated based on different PA types, intensity METs and durations.
4.4. Relationships Between Functional Ability and PA Amount
4.4.1. Functional Ability and Weekly PA Duration
A curve A pattern dose-response relationship between functional ability and weekly PA duration was found in the middle-old female group (Figure 2). The curve has a slope starts at weekly PA duration around 20 minutes to about 150 mins. The top functional benefit can’t be determined, with 95% confidence that the functional ability benefit is greater than the lower limit (Table 3). Middle-old females benefit from every more minute spent on PA starts as low as 20 mins per week to about 150 mins per week. Older women aged 75 to 84 years are suggested to spend at least amount of 150 mins per week on PA in order to achieve the most functional benefits (Figure 2).
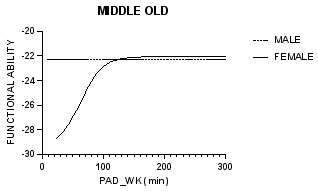
Figure 2. Functional ability and PA duration/week (min) in middle-old group.
Table 3. Relationships between functional ability and weekly PA duration.

Middle-old female

Middle-old male

Male old-old

Female old-old

Best-fit values

Bottom

-22.02

-22.23

-24.64

-24.15

Top

-29.46

Unstable

-22.60

-23.25

logEC50

61.91

Unstable

Unstable

Unstable

HillSlope

-0.02378

Unstable

Unstable

Unstable

EC50

8.190e+061

Unstable

Unstable

Unstable

Span

-7.434

Unstable

2.041

0.8998

95% CI (profile likelihood)

Bottom

-23.59 to -20.29

-22.90 to -21.55

-29.58 to -21.82

-27.45 to-22.55

Top

?

(very wide)

-26.48 to -18.72

-25.84 to-20.66

Goodness of Fit

Degrees of Freedom

69

120

16

30

R squared

0.2211

0.000

0.06906

0.01852

Sum of Squares

1022

1748

495.8

680.1

Sy.x

3.848

3.816

5.566

4.761

Number of points

# of X values

293

176

40

77

# Y values analyzed

73

124

20

34

Dose-response relationship was undefined in all the other age and gender groups. However, possible PA duration threshold may exist in the old-old group. Older men and women aged 85 years and older need to spend around 240 mins per week in PA in order to gain higher levels of functional ability (Figure 3). However, this conclusion should be carefully made due to small variances explained (R squared=.018-.069).
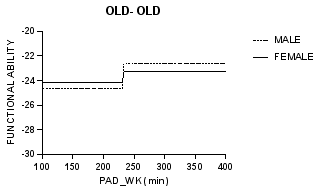
Figure 3. Functional ability and PA duration/ week in old-old group.
4.4.2. Functional Ability and Daily Step Counts
Dose-response relationship was not identified between step counts and functional ability in older adults. However, top and bottom values (ranges) were identified with 95% confidence interval in the middle-old adult group (Table 4). They could be interpreted as thresholds of daily steps by which older adults’ functional ability reaches significant higher levels. Older adults aged 75-84 year need to have about 5800 daily steps in order to maintain functioning (Figure 4). No difference was found between different genders.
Table 4. Relationships between functional ability and steps per day.

Middle-old

Best-fit values

Bottom

-22.79

Top

-23.84

Span

-1.044

95% CI (profile likelihood)

Bottom

-23.68 to -21.90

Top

-24.76 to -22.92

Goodness of Fit

Degrees of Freedom

211

R squared

0.01206

Sum of Squares

4792

Sy.x

4.766

Number of points

# of X values

876

# Y values analyzed

215

Table 5. Relationships between functional ability and weekly energy expenditure.

Middle-old

Female middle-old

Best-fit values

Bottom

-22.75

-22

Top

-21.50

-24.16

Span

1.255

-2.161

95% CI (profile likelihood)

Bottom

-23.39 to -22.12

-23.39 to -20.61

Top

-22.88 to -20.12

-25.64 to -22.69

Goodness of Fit

Degrees of Freedom

179

62

R squared

0.01456

0.06838

Sum of Squares

2814

1046

Sy.x

3.965

4.108

Number of points

# of X values

714

273

# Y values analyzed

183

66

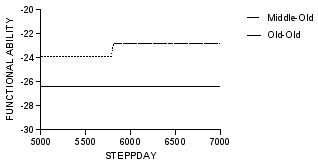
Figure 4. Relationship between functional ability and steps per day (STEPPDAY).
4.4.3. Functional Ability and Weekly Energy Expenditure
The hypothesized dose-response relationship between functional ability and weekly energy expenditure in middle and old-old adults was undefined. However, similar energy expenditure thresholds were identified by which functional ability reached higher level in 75-84 year older female adults. Female middle-old adults need to spend weekly energy of 800 kcal on PA to obtain higher functioning in doing daily activities (Figure 5). However, these values should be carefully concluded since very small variances were explained.
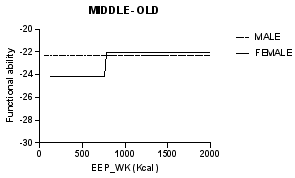
Figure 5. Functional ability and weekly energy expenditure (EEP_WK) in middle-old adults.
5. Discussion
Our study found dose-response relationships between the amount of time spent on PA and functional ability in middle-old females. Females aged 75-84 gain higher levels of functional ability when spending more time on PA. The functional benefits gain was the fastest when they spent every one more minute on PA up until about 150 minutes in a week (Figure 2). The highest benefit is achieved when spending at least 150 minutes per week on PA. Researchers observed dose-response relationships between PA and improvement in activity of daily living, quality of life, and independent living in the older adults Other researchers also concluded that a lower limit in the dose-response relationship between PA level and health gains seem not exist, and any activity can be said better than none These findings were accordant to our results. The 150 mins/week threshold is consistent with the guidelines recommended amount (150-300 min) for 65+ older adults
The study didn’t find any dose-response relationship in all the other age or gender groups. However, possible thresholds were identified (Figures 3, 4, 5). Both male and female older adults aged 85 year and older need to spend around 240min/week in PA to gain functional benefits. Gender has much less impact as older adults age. This finding was similar to the systematic report of PA prevalence across gender and age groups . However, these cutting values should be carefully interpreted. There is lack of evidence on PA duration threshold/ cutting value in 75 year and older age groups.
Researchers had reported positive correlations between energy expenditure and health benefits, including functional status, mortality, etc., in older people Total energy expenditure was considered as primary contributors to health gain compared to PA intensity. A minimum "target dose" that will yield substantial health gains for older adults corresponds to an energy expenditure of approximately 150 kcal (630 kJ) per day or slightly more than 1,000 kcal (4.2 MJ) per week . This study hadn’t identified any relationship between energy expenditure and functional ability in 75 year and older adults. This could due to study limitations, or there is a need for more research on the topic However, possible threshold was found around 800kcal/week for middle-old females. Females aged 75- 84 year old spend less energy expenditure than the general 65 year and older adults since energy expenditure declines as people age . The possible needed weekly energy expenditure amount (800kcal) is similar to other studies results.
Our study was not able to find dose-response relationship, however, it indicated a possible needed number of 5,800 steps/day for aged 75-84 older adults. Ewald’s (2014) study reported daily step threshold of 5,900 for aged 70–75, and 5,150 for aged 75 and over adults . Many studies used 5,000 daily steps as basic amount for activities of living . Lower doses of steps (< 5000 daily) were related to poor functionality in older adults compared to the medium and high dose of daily steps . The identified number of 5,800 daily step counts for 75-84 year old adults was similar to other study recommendations. No difference was found in daily walking steps between male and female older adults. A number of 7,100-8,000 daily steps was considered equal to the public health guidelines recommended physical activity amount for 65 year and older adults . Fewer daily walking steps are needed as people gets older. The identified step value does indicated less amount of PA needed for 75 year and older adults than the general 65 year and older population.
6. Study Limitations
Study limitations included the cross-sectional datasets, large amount of missing values, and lack of adequate sensitivity of dependent variable. PA amount/dose and functional ability data were both collected in the same time frame based on a nationally representative sample. It would be better if PA dose variable was tracked for a long-term period in order to examine their functional responses. Missing data was another limitation using NHANES PA datasets, especially in self-reported data. More than 40 types of leisure-time PA, including duration and frequency, difficulty levels in performing 21 types of daily activities were all recorded using self-reported questionnaires, which resulted large missing data. The other limitation is the variable feature of functional ability/benefits. Functional ability was summed from a four-level Likert scale and scored collectively from 21 short-answer questions. The difference among four levels were not sensitive enough and lacking specific criteria in categorization, which resulted limited variance in study findings. It would be better if functional ability was measured more specifically and could reflect enough variance among study participants.
7. Implications for Nursing Practice and Health Policy
This study is one of a few studies that explored the dose-response effects of PA among sub-age and gender groups in 75 year and older adults. The study examined the number of daily steps, weekly PA duration, energy expenditure needed, and the importance of maintaining long-term habitual PA in relation to functional ability. It adds to the current knowledge about PA as health promotion strategies in older populations. The study also contributed as reference to PA dosage prescription and public health policy in older adults. The study results can be directly applied in nursing practices, such as health education on the importance of long-term habitual PA engagement, ensuring enough amounts of daily PA, and awareness of variances in different older age and gender groups.
8. Conclusions
PA benefits functional health in 75 year and older adults. Engaging in enough amount of PA and maintaining active level habitualy can improve older adults’ functional ability at later ages. Dose-response relationships were identified between functional ability of older women (aged 75- 84 years) and time spent in PA every week. The more time spent on PA, the higher benefits gained in functional ability. One hundred fifty minutes of PA per week is the least amount of time needed to obtain the most benefits. Females aged 75-84 year need to spend at least 150 mins /800 kcal energy expenditure per week or 5,800 daily steps to obtain higher functional benefits. Older men aged 75-84 year need walk about 5,800 daily steps to maintain functional ability. Both male and female old-old adults (85 year and above) are recommended to spend around 240 mins/ week on PA to maintain higher levels of functionality. However, these threshold/cutting values should be interpreted with caution and no causality conclusion should be drawn.
As older adults age, fewer daily steps, less time, and less energy expenditure were needed on PA in order to maintain health benefits. Male older adults generally require more amounts of PA compared to females, however, gender difference decreases as their age increases. It seems that different dimensions of PA have different sensitivities between 75 year and older male and female adults, such as PA intensity (daily step counts) is more reflective of male older adults when describing PA level or needed amount, while PA duration is more meaningful to female older adults.
Abbreviations

PA

Physical Activity

NHANES

National Health and Nutrition Examination Survey

PAGAC

Physical Activity Guidelines Advisory Committee

NCHS

National Center for Health Statistics

HHS

Department of Health and Human Services

PFQ

Physical Functioning Questionnaires

PAQ

Physical Activity Questionnaires

Conflicts of Interest
The authors declare no conflicts of interest.
References
[1] Zizza, C. A., Ellison, K. J., & Wernette, C. M. (2009). Total Water Intakes of Community- Living Middle-Old and Oldest-Old Adults. The Journals of Gerontology Series A: Biological Sciences and Medical Sciences. 64A (4): 481–486.
[2] Little, W., & McGivern, R. (2019). Aging and the Elderly. Introduction To Sociology- 1st Canadian Edition. licensed under a Creative Commons Attribution 4.0 International License.
[3] Cicirelli, Victor G. (2002). Older Adults' Views on Death. Springer Pub. ISBN 9780826170125.
[4] Jacelon C. S. (2010). Maintaining the balance: older adults with chronic health problems manage life in the community. Rehabilitation nursing : the official journal of the Association of Rehabilitation Nurses, 35(1), 16–40.
[5] U.S. Department of Health and Human Services. (2018). Physical Activity Guidelines for Americans, 2nd edition. Washington, DC: U.S. Department of Health and Human Services.
[6] World Health Organization. (2020). Guidelines on Physical Activity and Sedentary Behaviour. Geneva: World Health Organization; License: CC BY-NC-SA 3.0 IGO.
[7] Sun, F., Norman, I. J., & While, A. E. (2013). Physical activity in older people: A systematic review. BMC Public Health, 13, 449.
[8] Bouchard, C., W. Hollmann, H. Venrath, G. Herkenrath, & H. Schlussel. (1966). Minimal amount of exercise for the prevention of cardiovascular diseases (Minimalbelastungen zur Pra¨vention Kardiovaskularer Erkrankungen). Sportarzt und Sportmedizin. 17: 348–357.
[9] Bouchard, C. (2001). Physical activity and health: Introduction to the dose-response symposium. Medicine and Science in Sports and Exercise, 33(6 Suppl), S347-350.
[10] Antero Kesaniemi, Y., Danforth, E., Jensen, M. D., Kopelman, P. G., Lefèbvre, P., & Reeder, B. A. (2001). Dose-response issues concerning physical activity and health: An evidence-based symposium. Medicine & Science in Sports & Exercise, 33(6), S351.
[11] Etman, A., Pierik, F. H., Kamphuis, C. B. M., Burdorf, A., & van Lenthe, F. J. (2016). The role of high-intensity physical exercise in the prevention of disability among community-dwelling older people. BMC Geriatrics, 16(1), 183.
[12] Pereira, C., Baptista, F., & Cruz-Ferreira, A. (2016). Role of physical activity, physical fitness, and chronic health conditions on the physical independence of community-dwelling older adults over a 5-year period. Archives of Gerontology and Geriatrics, 65, 45–53.
[13] Fielding, R. A., Guralnik, J. M., King, A. C., Pahor, M., McDermott, M. M., Tudor-Locke, C., Manini, T. M., Glynn, N. W., Marsh, A. P., Axtell, R. S., Hsu, F.-C., & Rejeski, W. J. (2017). Dose of physical activity, physical functioning and disability risk in mobility-limited older adults: Results from the LIFE study randomized trial. Plos One, 12(8), e0182155.
[14] Tomita, M. R., Fisher, N. M., Nair, S., Ramsey, D., & Persons, K. (2018). Impact of Physical Activities on Frailty in Community-Dwelling Older Women. Physical & Occupational Therapy in Geriatrics, 36(1), 107–119.
[15] Physical Activity Guidelines Advisory Committee. (2018) 2018 Physical Activity Guidelines Advisory Committee Scientific Report. Washington, DC: U.S. Department of Health and Human Services.
[16] Cabanas-Sánchez, V., Higueras-Fresnillo, S., De La Cámara, M. Á., Esteban-Cornejo, I., & MARTÍNEZ-GÓmez, D. (2019). 24-h Movement and Nonmovement Behaviors in Older Adults. The IMPACT65+ Study: Medicine & Science in Sports & Exercise, 51(4), 671–680.
[17] Tudor-Locke, C., Hatano, Y., Pangrazi, R. P., & Kang, M. (2008). Revisiting “How Many Steps Are Enough?”: Medicine & Science in Sports & Exercise, 40(Supplement), S537–S543.
[18] Tudor-Locke Catrine, Craig Cora L, Aoyagi Yukitoshi, Bell Rhonda C, Croteau Karen A, De Bourdeaudhuij Ilse, Ewald Ben, Gardner Andrew W, Hatano Yoshiro, Lutes Lesley D, Matsudo Sandra M, Ramirez-Marrero Farah A, Rogers Laura Q, Rowe David A, Schmidt Michael D, Tully Mark A, & Blair Steven N. (2011). How many steps/day are enough? For older adults and special populations. International Journal of Behavioral Nutrition and Physical Activity, 1, 80.
[19] Tudor-Locke, C., & Bassett, D. R. (2004). How Many Steps/Day Are Enough?: Preliminary Pedometer Indices for Public Health. Sports Medicine, 34(1), 1–8.
[20] Kang, M., Marshall, S. J., Barreira, T. V., & Lee, J.-O. (2009). Effect of Pedometer-Based Physical Activity Interventions: A Meta-Analysis. Research Quarterly for Exercise & Sport, 80(3), 648–655.
[21] Kraus, W. E., Janz, K. F., Powell, K. E., Campbell, W. W., Jakicic, J. M., Troiano, R. P., Sprow, K., Torres, A., & Piercy, K. L. (2019). Daily Step Counts for Measuring Physical Activity Exposure and Its Relation to Health: Medicine & Science in Sports & Exercise, 51(6), 1206–1212.
[22] Aoyagi, Y., Park, H., Watanabe, E., Park, S., & Shephard, R. J. (2009). Habitual physical activity and physical fitness in older Japanese adults: The Nakanojo Study. Gerontology, 55(5), 523–531.
[23] de Melo, L. L., Menec, V. H., & Ready, A. E. (2014). Relationship of functional fitness with daily steps in community-dwelling older adults. Journal of Geriatric Physical Therapy (2001), 37(3), 116–120.
[24] Ewald, B., Attia, J., & McElduff, P. (2014). How Many Steps Are Enough? Dose--Response Curves for Pedometer Steps and Multiple Health Markers in a Community-Based Sample of Older Australians. Journal of Physical Activity & Health, 11(3), 509–518.
[25] Havighurst, R. J. (1961). "Successful ageing". The Gerontologist. 1: 8– 13.
[26] Haskell, W. L. (1994). Health consequences of physical activity: under Standing and challenges regarding dose-response. Med. Sci. Sports Exer, 26: 649–660.
[27] Haskell, W. L. (1994). Dose-response issues from a biological perspective. In: Physical Activity, Fitness, and Health, C. Bouchard, R. J. Shephard, and T. Stephens (Eds.). Champaign, IL: Human Kinetics, pp. 1030–1039.
[28] Shephard, R. J. (2002). Gender, physical activity, and aging. CRC Press.
[29] Spirduso, W. W. & Cronin, D. L. (2001). Exercise dose-response effects on quality of life and independent living in older adults. Med Sci Sports Exerc. 33: S598-608; discussion S609-510, 2001., DC, 2005.
[30] Rankinen, T., Bouchard, C., Corbin, C. B., Pangrazi, R. P., & Franks, D. (2002). Dose-Response Issues Concerning the Relations Between Regular Physical Activity and Health [dataset]. American Psychological Association.
[31] Anderssen, S. A., & Strømme, S. B. (2001). Physical activity and health—Recommendations. Tidsskrift for den Norske laegeforening, 121(17), 2037–2041.
[32] Sparling, P. B., Howard, B. J., Dunstan, D. W., & Owen, N. (2015). Recommendations for physical activity in older adults. BMJ: British Medical Journal, 350.
[33] Manini, T. M., & Pahor, M. (2009). Physical activity and maintaining physical function in older adults. British Journal of Sports Medicine, 43(1), 28–31.
[34] Lopes de Pontes, T., Pinheiro Amador Dos Santos Pessanha, F., & Freire, R. C., et al. (2021). Total Energy Expenditure and Functional Status in Older Adults: A Doubly Labelled Water Study. J Nutr Health Aging, 25, 201–208.
[35] Hall, K. S., Morey, M. C., Dutta, C., Manini, T. M., Weltman, A. L., Nelson, M. E., Morgan, A. L., Senior, J. G., Seyffarth, C., & Buchner, D. M. (2014). Activity-Related Energy Expenditure in Older Adults: A Call for More Research. Medicine & Science in Sports & Exercise, 46(12), 2335–2340.
[36] Sarling, R. D. (2001). Energy Expenditure and Aging: Effects of Physical Activity. International Journal of Sport Nutrition and Exercise Metabolism, 11, S208-S217.
[37] Dondzila, C. J. 1, cdondzil@citadel. edu, Gennuso, K. P. 2, Swartz, A. M. 2, Tarima, S., Lenz, E. K. 4, Stein, S. S. 5, Kohl, R. J. 5, & Strath, S. J. 2. (2015). Dose-Response Walking Activity and Physical Function in Older Adults. Journal of Aging & Physical Activity, 23(2), 194–199.
[38] Duncan, M., Minatto, G., & Leddington wright, S. (2016). Dose-response between pedometer assessed physical activity, functional fitness, and fatness in healthy adults aged 50-80 years: DOSE-RESPONSE OF PHYSICAL ACTIVITY. American Journal of Human Biology, 28.
Cite This Article
  • APA Style

    Chen, C., Jacelon, C., Choi, J. (2024). How Much Physical Activity Is Needed for 75 Year and Older Adults: Using NHANES Datasets. Science Journal of Public Health, 12(3), 92-102. https://doi.org/10.11648/j.sjph.20241203.15

    Copy | Download

    ACS Style

    Chen, C.; Jacelon, C.; Choi, J. How Much Physical Activity Is Needed for 75 Year and Older Adults: Using NHANES Datasets. Sci. J. Public Health 2024, 12(3), 92-102. doi: 10.11648/j.sjph.20241203.15

    Copy | Download

    AMA Style

    Chen C, Jacelon C, Choi J. How Much Physical Activity Is Needed for 75 Year and Older Adults: Using NHANES Datasets. Sci J Public Health. 2024;12(3):92-102. doi: 10.11648/j.sjph.20241203.15

    Copy | Download

  • @article{10.11648/j.sjph.20241203.15,
      author = {Chunfang Chen and Cynthia Jacelon and Jeungok Choi},
      title = {How Much Physical Activity Is Needed for 75 Year and Older Adults: Using NHANES Datasets
    },
      journal = {Science Journal of Public Health},
      volume = {12},
      number = {3},
      pages = {92-102},
      doi = {10.11648/j.sjph.20241203.15},
      url = {https://doi.org/10.11648/j.sjph.20241203.15},
      eprint = {https://article.sciencepublishinggroup.com/pdf/10.11648.j.sjph.20241203.15},
      abstract = {Targets: To examine the amount/level of Physical Activity (PA) needed to generate the most health benefits in noninstitutionalized 75 year and older U.S. resident adults. Intervention description: A total of 598 sample participants aged 75 year and above from National Health And Nutrition Examination Survey (NHANES) 2005-2006 datasets were included. Actigraph-monitored daily step counts, self-reported PA duration (time spent in weekly PA) and weekly energy expenditure were used to describe PA level/amount. Functional ability was expressed using the total levels of difficulties in doing twenty-one types of daily activities. PRISM Dose-response Curves Stimulation Variable slope model was applied to examine the needed PA level/amount in the population. Mechanisms of action: PA benefits functional health in 75 year and older adults. Older females aged 75- 84 year need at least 150 mins/ 800 kcal energy expenditure per week or 5,800 daily steps to reach the most functional benefits. Older men aged 75-84 year need walk about 5,800 steps/day to achieve higher level of functionality. Older adults aged 85 years and above need to spend about 240 minutes/week on PA to gain health benefits. Outcomes: Older males generally need/engage in more amount of PA compared to their female counterparts. Between 75-84 year old male and female adults, PA intensity is more important/reflective in male for expressing PA amount, while time spent in PA is more meaningful to older females. There is no difference in needed PA amount between different genders in 85 year and older adults.
    },
     year = {2024}
    }
    

    Copy | Download

  • TY  - JOUR
    T1  - How Much Physical Activity Is Needed for 75 Year and Older Adults: Using NHANES Datasets
    
    AU  - Chunfang Chen
    AU  - Cynthia Jacelon
    AU  - Jeungok Choi
    Y1  - 2024/06/26
    PY  - 2024
    N1  - https://doi.org/10.11648/j.sjph.20241203.15
    DO  - 10.11648/j.sjph.20241203.15
    T2  - Science Journal of Public Health
    JF  - Science Journal of Public Health
    JO  - Science Journal of Public Health
    SP  - 92
    EP  - 102
    PB  - Science Publishing Group
    SN  - 2328-7950
    UR  - https://doi.org/10.11648/j.sjph.20241203.15
    AB  - Targets: To examine the amount/level of Physical Activity (PA) needed to generate the most health benefits in noninstitutionalized 75 year and older U.S. resident adults. Intervention description: A total of 598 sample participants aged 75 year and above from National Health And Nutrition Examination Survey (NHANES) 2005-2006 datasets were included. Actigraph-monitored daily step counts, self-reported PA duration (time spent in weekly PA) and weekly energy expenditure were used to describe PA level/amount. Functional ability was expressed using the total levels of difficulties in doing twenty-one types of daily activities. PRISM Dose-response Curves Stimulation Variable slope model was applied to examine the needed PA level/amount in the population. Mechanisms of action: PA benefits functional health in 75 year and older adults. Older females aged 75- 84 year need at least 150 mins/ 800 kcal energy expenditure per week or 5,800 daily steps to reach the most functional benefits. Older men aged 75-84 year need walk about 5,800 steps/day to achieve higher level of functionality. Older adults aged 85 years and above need to spend about 240 minutes/week on PA to gain health benefits. Outcomes: Older males generally need/engage in more amount of PA compared to their female counterparts. Between 75-84 year old male and female adults, PA intensity is more important/reflective in male for expressing PA amount, while time spent in PA is more meaningful to older females. There is no difference in needed PA amount between different genders in 85 year and older adults.
    
    VL  - 12
    IS  - 3
    ER  - 

    Copy | Download

Author Information
  • Abstract
  • Keywords
  • Document Sections

    1. 1. Introduction
    2. 2. Theoretical Framework
    3. 3. Methods
    4. 4. Results
    5. 5. Discussion
    6. 6. Study Limitations
    7. 7. Implications for Nursing Practice and Health Policy
    8. 8. Conclusions
    Show Full Outline
  • Abbreviations
  • Conflicts of Interest
  • References
  • Cite This Article
  • Author Information